
I Made $30,755 Riding the Trump Spike. Here's Why I'm Not Celebrating.
The bounce arrived on schedule...


Yesterday the Dow gained over 1,000 points.
The Nasdaq ripped 3.34%. The S&P surged 2.45%. It was the best trading day in nearly a year.
The catalyst?
A Wall Street Journal report that Trump told aides he is willing to end the war with Iran — even without reopening the Strait of Hormuz.
One headline. Trillions of dollars moved in hours.
Pretty much the same as last week…
I was ready for it both times.
The Scorecard
Here are my numbers since the last issue — March 22 through March 31:
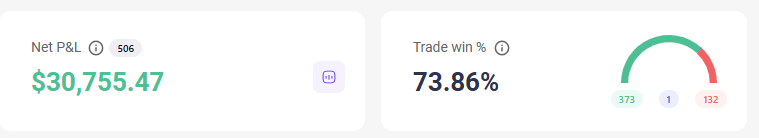
I caught the Trump spike. Not because I am psychic. Because I follow a system and I pay attention to the setup.
The political pressure was obvious. Gas over $5 in California. Polls dropping. His own party turning on him. The military saying there is nothing left to target. And Trump’s pattern — push hard, let the market panic, then find the off-ramp — has played out the same way every single time. Tariffs last April. Same playbook.
The trade was there. I took it.
However, it wasn’t as easy as I thought… I did take some losses on Monday which set me back and dropped my win rate but I made it all back and more yesterday.
Mr. Market never makes it easy for anyone… even though I was very confident in the bounce, I still took some losses
But here is the part most people will not want to hear.
I am not celebrating. I am bracing for a potential larger correction and or potential end of the bull run.
The Game Being Played
Let me tell you what happened this week.
On Sunday, Iran’s Parliament Speaker went on X. He told investors — in English — that Trump’s pre-market posts are a “reverse indicator.” His advice: if they pump it, short it. If they dump it, go long.
Monday morning. 7:26 AM. Two hours before the open. Trump posted on Truth Social that “great progress has been made” on a deal with Iran. Stocks jumped. Within an hour, Rubio went on ABC and said the opposite. Iran said there are no talks at all.
Then yesterday. The Wall Street Journal said Trump told aides he would end the war — even without opening the Strait. The Dow gained 1,000 points. Nasdaq ripped 3.34%.
And the Iranian Speaker’s advice? It worked. Iran is now making better market calls than CNBC.
This is not normal. This is a casino. One man controls the wheel.
Last week, the S&P moved $3 trillion in 56 minutes after Trump’s March 23 post. There were huge volume spikes in futures minutes before that post hit. Not hours. Minutes.
Draw your own conclusions.
Follow The Money
There is a deeper game here. If you are only watching the news, you are missing it.
Defense contractors met with Trump at the White House weeks before the first bombs fell. Lockheed. Raytheon. Boeing. BAE. Northrop. L3Harris. Honeywell. All of them. Trump said they agreed to make four times more weapons. He called them “Exquisite Class.”
The Lockheed chart started running three months before that meeting. Three months. Someone knew.
Congress approved $900 billion in defense spending for 2026. The defense ETF is up 56% in a year. War is good for business. It always has been.
Then look at Venezuela. Only US-approved firms can buy the oil now. Payments go to an account in Qatar that Trump controls. Revenue to Venezuela’s government? Only if Trump says so.
And Iran? Ask yourself why no one is talking about the petrodollar. Oil is priced in dollars. Every barrel on the planet. That is what gives the US its power. That is what makes the dollar the reserve currency.
Iran was selling oil in yuan. Working with China and Russia to cut the dollar out. That is a direct threat to American power.
That is very like what this is all about.
The Cycle Does Not Care About Headlines
Most people think the war caused this mess. They are wrong.
The mess was already coming. The war just lit the match. The fuel had been there for years.
Phil Anderson has been writing about this for decades. The economy runs on a cycle. About every 18 years, land prices peak. Money gets too loose. People borrow too much. Yields rise. And the whole thing falls over.
It happened in 1973. It happened in 1990. It happened in 2008.
The last low was around 2010-2012. Add 14 years of growth and you land right here. Right now. The peak.
Every time this happens, people blame the event they can see. In 1973 they blamed the oil embargo. But land had already peaked. Credit was already stretched. The embargo was the match. Not the fuel.
Same thing today. Iran is the match. But too much money chasing land, rising yields, private credit issues, wild speculation on borrowed cash — all of that was already here.
Even if the war cools — and I think it will — the economy is heading for trouble. And what comes next is always the same: tight money, job losses, margin calls, falling prices.
The time frame for this? I’ll tell you in a second.
What I Am Doing
I took profits on the spike.
The bounce I expected has arrived. It may have more room into April — especially if Trump keeps feeding headlines. But every day without a real deal, the April 6 deadline gets closer. If it passes with no progress, oil retests its highs and the rally fades.
Here is how I see the next few weeks playing out. There are three paths. Only one of them is bullish.
Scenario A: S&P reclaims 7,000+ before late April
This means the March 30 low was just a normal dip in a bull trend. The war. Three weeks of selling. The market took the punch and kept going. That tells you the bull market is alive.
What to do: Stay long. The real top comes later — probably fall. September or October. That is when you got to cash and think about going short.
The risk: You are riding a late-cycle move. Keep tight stops. Do not get greedy.
Scenario B: S&P makes a lower high below 7,000 in late April
This is the dangerous one. It means the January 28 high was THE high. Maybe for the year. Maybe for the cycle. The rally from March 30 was just a dead cat bounce. The market could not take back what it lost.
The chart would show: January 28 high, then a lower high in April. If the market then breaks below the March 30 low, the trend has changed.
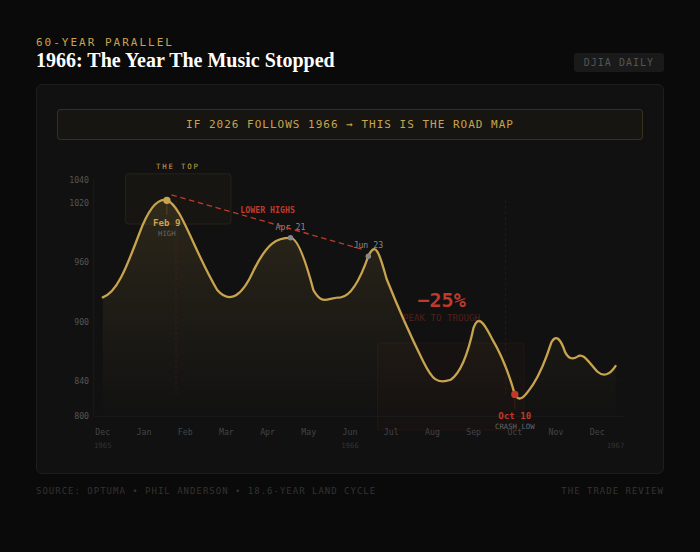
The bearish forecast curve — the one based on 1966, sixty years ago — would be the one to follow. That year fell because of rising long-term rates from war spending. Sound familiar?
Take a look for yourself…
What to do: Late April take profits and become defensive. The decline could restart and speed up into summer.
Scenario C: S&P gets close to 7,000 but stalls right at it
Something in between… the market rallies into late April. Gets to 6,900. Maybe 7,000. Then it stalls. Pulls back.
If the May pullback is shallow — holds above 6,600 — and only lasts a week or two, it is Scenario A delayed. The breakout comes in June and the blow-off runs into fall.
If the May pullback is deep — breaks below the March 30 low around 6,200 — and keeps going, it is Scenario B confirmed.
I do not need to guess which one it is right now. The market will tell me. I just have to watch and listen.
The people glued to cable news, watching Trump’s Truth Social for clues, hanging on every headline — they will make worse choices than you will with a simple plan and five minutes of focus every day reviewing charts.
I promise you that.
I’ll keep watching and updated you as we go on.
See you in the next issue.
The elegance is in the execution.
— Brian
Why trading curde oil or USD