
Mark Your Calendar: What a Once-in-500-Million Event Just Set in Motion for Silver
A 6-Sigma Event, the Power of 30, and What September 4th Could Mean for Traders

I still remember the phone call.
It was late. Everyone in the house was asleep. But I was up, doing what I always do — hunched over my desk, scanning charts, looking for the one setup that would make the whole week worth it.
Then my buddy John called. He never calls that late. So I picked up.
“You seeing this?” he said. His voice was tight. Almost a whisper.
I looked at silver…
In one move—one brutal, violent, history-making move—silver had fallen from $124 to $64. That is not a typo. It fell almost 50% in a matter of days. The kind of crash you read about in old books about panics and bank runs. The kind of thing that is not supposed to happen.
And yet, there it was. Right on my screen.
John was quiet on the other end. Then he said, “What do we do now?”
That is a good question. And if you trade silver—or you are thinking about it—then what I am about to share might be the most important thing you read all year.
What Is a 6-Sigma Event (And Why Should You Care)?
Let me keep this simple.
In statistics, a “sigma” measures how far something moves from what is normal. One sigma? That happens all the time. Two sigma? Less common but not shocking. Three sigma? Now you are getting into rare territory.
Five sigma? That is supposed to happen once every 14,000 years.
But six sigma? That is supposed to happen once in 500 million occurrences.
Let me say that again. Once in 500 million.
To put that in perspective: the entire US stock market has only had about 35,000 trading days in its history. A 6-sigma event is not supposed to happen even once in that entire span. Not even close.
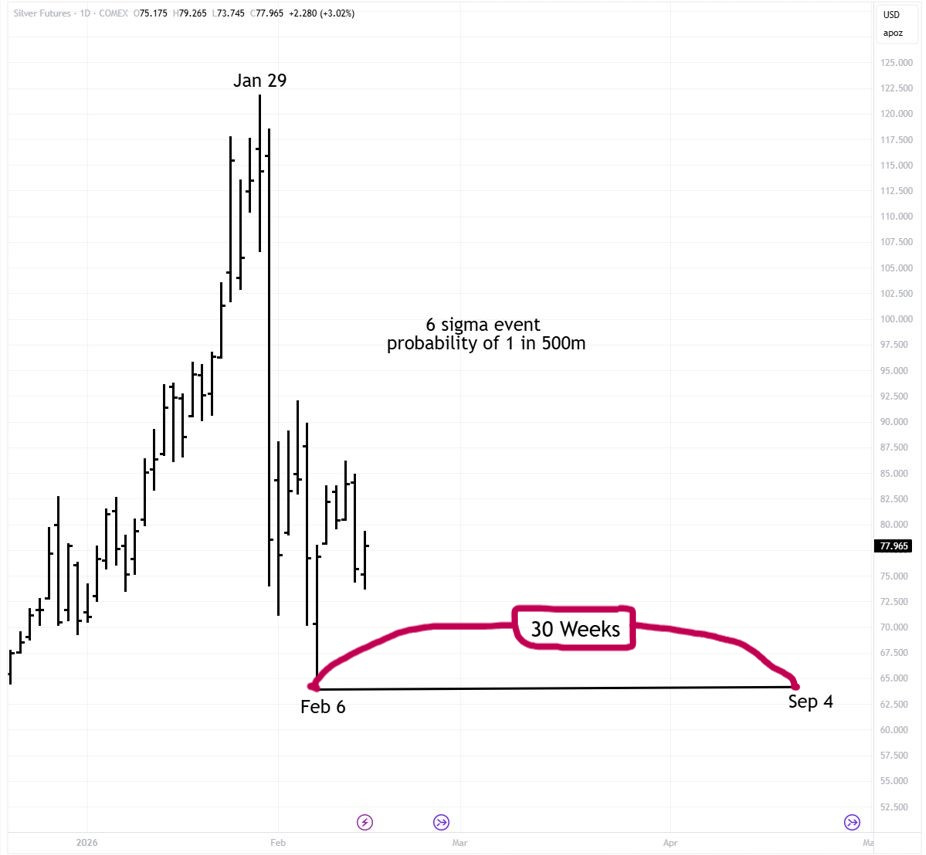
That is what happened to silver between January 29 and February 6, 2026.
Silver peaked near $124 on January 29. Just eight days later, it hit $64. The move was so fast, so extreme, that it broke statistical models. It was the kind of event that quants and professors say should almost never happen.
But here is the thing they do not tell you in textbooks.
These events do happen. They happen more often than the math says they should. And when they do, they leave a mark. Not just on the charts. On the traders who live through them. On the markets that follow.
And most importantly—they create opportunity.
Because after an event this extreme, markets do not just drift. They reset. They find a new rhythm. And that new rhythm often follows patterns that go back decades.
Patterns built on the number 30.
Why 30 Is the Most Important Number in Trading
If you have been around markets long enough, you start to notice something strange. Certain numbers keep showing up. Not because someone decided they should. But because markets are made of people. And people—our emotions, our fears, our cycles of hope and panic—run on rhythms.
The number 30 is everywhere.
There are roughly 30 days in a calendar month. There are roughly 30 trading days in six calendar weeks. The moon takes about 29.5 days to complete its cycle. Many agricultural and commodity cycles align with multiples of 30.
But it goes deeper than that.
W.D. Gann, one of the most studied traders in history, built much of his work around this number. He observed that major market turns tend to happen in clusters of 30. Thirty days. Thirty weeks. Thirty months. Three hundred months. The multiples show up again and again at turning points that most traders would call “coincidence.”
But here is the question I always ask: How many coincidences does it take before it is no longer a coincidence?
Let me show you what I mean.
The September 11 Time Cycle: A Real-World Example
September 11, 2001. Everyone alive that day remembers where they were. It was not just a tragedy. It was a shock to the system—emotional, political, and financial. Markets shut down. When they reopened, they fell hard.
Now watch what happens when you count forward from that date using multiples of 30 months.
Ninety months after September 11, 2001, brings you to March 2009. That was the exact bottom of the Great Recession. The S&P 500 hit 666 and turned. One of the greatest buying opportunities in the last 50 years. Ninety months. That is three cycles of 30.
Two hundred forty months after September 11, 2001, brings you to September 2021. That is the month the United States pulled out of Afghanistan—closing the chapter that began on that very day in 2001. Markets were topping out. Crypto was peaking. The easy money era was ending. Two hundred forty months. That is eight cycles of 30.
Three hundred sixty months after September 11, 2001, brings you to September 11, 2031. Twelve cycles of 30. We do not know what will happen that day. But if the pattern holds, it could mark a significant low—or a major turning point.
Now, you can look at this and say, “That is just numbers.” And maybe it is. But when the numbers keep lining up at moments that change history, I pay attention. And you should too.
Silver, September 4, and the 30-Week Window
Now let us bring it back to silver.
Silver hit its low on February 6, 2026. That was the day the 6-sigma crash bottomed out.
Count forward 30 weeks from February 6. Where do you land?
September 4, 2026.
Thirty weeks. One full cycle of 30.
Based on what we know about time cycles, September 4 is a date to circle on your calendar. It does not mean silver will crash that day. It does not mean it will spike. But it means something is likely to happen—a reaction, a turn, a shift in momentum. The kind of move that traders can position for if they are paying attention.
This is how time cycles work. They do not give you a guarantee. They give you a window. A moment where the odds tilt in your favor. And in trading, tilted odds are everything.
Think about it like a surfer. You cannot create a wave. But if you know when and where the waves tend to come, you can paddle out ahead of time and be ready. That is what a time cycle does. It tells you when to be in the water.
September 4 is one of those days.
But Here Is What I Am Really Watching For…
The September 4 date matters. But it is not the only thing I am tracking.
What I really want to see is a higher low.
In simple terms: silver bottomed at $64 on February 6. If, over the coming days or weeks, silver dips again but holds above $64—it will create a higher low. And that is important.
Why? Because a higher low after a 6-sigma crash tells you the market has absorbed the shock. It tells you buyers are stepping in at higher prices. It tells you the trend is shifting from panic to accumulation.
And when that higher low forms, we start counting again.
From that new low, we count 30 days, 30 weeks, 30 months. We look for the next window. The next moment where time and price come together in a way that gives us an edge.
This is not about predicting the future. This is about understanding time cycles. Markets breathe. They expand and contract. They crash and recover. And they do it on a schedule that most people never bother to learn.
What Comes Next
Here is what I know.
Silver just experienced the kind of move that is not supposed to happen. A 6-sigma event. A once-in-500-million occurrence. The charts are scarred. Traders are shaken. Most people have no idea what to make of it.
But the time cycles are already running.
September 4 is 30 weeks from the low. That is a date worth watching. And once silver forms its next higher low—whenever that happens—a whole new set of time windows will open up.
I will be tracking all of it.
So stay tuned because great opportunities are ahead of us.
—Brian