
The 5-Minute-a-Day System That Could Have Made You $89,250 in a Single Week
How I Broke Free From 12-Hour Screen Days and Started Making More Money Trading Less


I want to tell you how I really found this system.
It wasn’t because I was brilliant. It was because I was burned out.
At that time, I was trading “full time.” Sounds impressive. The reality was anything but.
I was a slave to the screen.
Up before dawn to check the European open. Glued to my monitors through the entire US session. Lunch at my desk — if I remembered to eat at all. The gym? Forgotten. Family dinners? A guilty memory.
I told myself I was trading for freedom. But somewhere along the way, I’d built myself a prison. And I was the only inmate.
My eyes burned. My back hurt. My nerves were shot. And here’s the cruel part — the more I watched, the worse I traded.
I was over-analyzing every tick. Reacting to noise like a lab rat hitting a lever. Buying when I should’ve been sitting on my hands. Selling the instant I felt a flicker of fear. Second-guessing every decision I made — and then second-guessing the second guess.
I knew something had to break. And I didn’t want it to be me.
I wanted my life back. I wanted to hit the gym again. See my friends. Sit down to a meal without one eye on a chart. I wanted to trade to live — not live to trade.
So I went on a mission. I was going to find a way to trade on my own terms — or I was going to quit altogether.
That’s when I started studying the old masters. Traders from a hundred years ago. Men like W.D. Gann. They didn’t have five-minute charts. They didn’t have CNBC screaming in the background twenty-four hours a day.
They looked at the market once a day. And they made fortunes.
That hit me like a slap in the face.
Here I was — glued to six monitors, subscribed to three news feeds, burning through my health and my sanity — and these guys were beating the market with a pencil and a daily chart.
What did they know that I didn’t?
That’s the question that changed everything. Because the answer wasn’t some complicated formula. It wasn’t a secret indicator. It was something so simple I almost didn’t believe it.
You don’t need 12 hours per day. You only need 5 minutes.
That’s when I found the mechanical trading system. A simple set of rules. And I realized that if I just looked at the chart once a day — at the close — I could make more money than I ever did staring at screens for 12 hours straight.
Not sometimes more. Consistently more.
So what is this system? Let me break it down for you — because it’s going to sound almost insultingly simple. And that’s exactly why it works.
The Mechanical System: Swing Trading
Part 1: How to Draw the Swing Chart
Most beginners get confused by the “noise” of daily candles. The Swing Chart filters out the noise and reveals the true path.
The Golden Rule: We only look at daily Highs and Lows). The “Close” does not matter.
Every single trading day will fall into one of these four categories. You must identify which one it is to know where to draw your line.
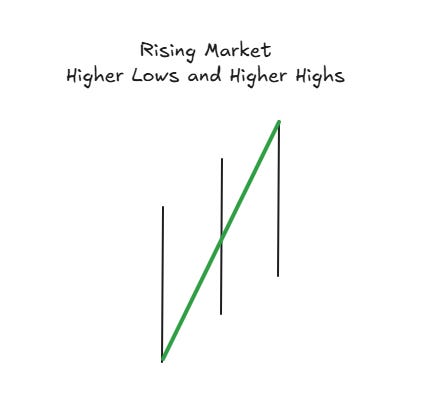
1. The Up Day (Green Light)
The Look: Today has a Higher High AND a Higher Low than yesterday.
The Logic: The market is marching upward.
The Action: Draw your line UP.
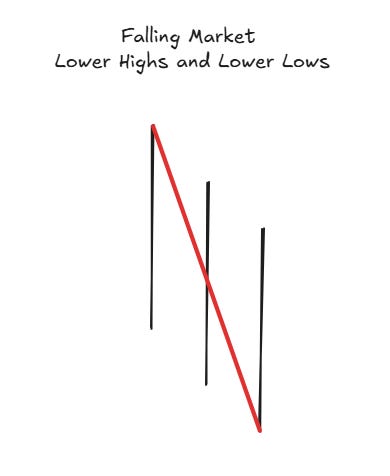
2. The Down Day (Red Light)
The Look: Today has a Lower High AND a Lower Low than yesterday.
The Logic: The market is marching downward.
The Action: Draw your line DOWN.
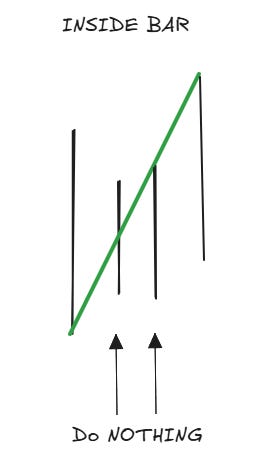
3. The Inside Bar (The “Pause”) – Crucial Rule
The Look: Today’s High is lower than yesterday’s High, AND today’s Low is higher than yesterday’s Low. The entire day fits “inside” yesterday.
The Logic: The market is resting. There is no new information.
The Action: DO NOTHING.
Do not draw a line.
Do not move the chart.
Pretend this day did not happen. The trend remains exactly where it was yesterday.
Part 2: The Entries
We do not jump in blindly. We wait for a specific “trigger.” There are three main ways to enter this mechanical system. There are multiple triggers so let’s cover the basic one first.
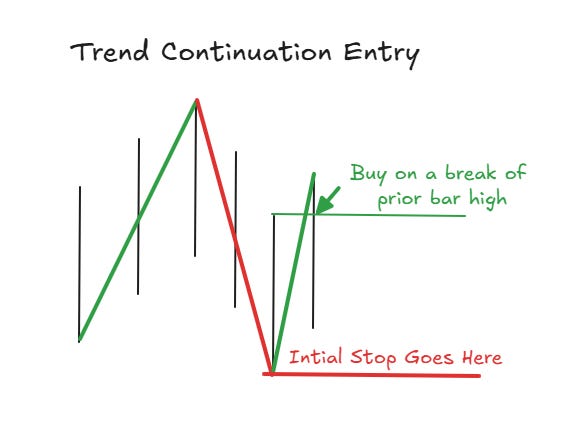
The Swing Entry (The Continuation)
This is safer. You are joining a trend that is already established.
The Setup: The Swing Chart is Green (Uptrend), but the market pulls back (Down Day) without breaking the swing bottom.
The Trigger: The price turns back up and breaks the high of the reaction bar.
The Action: Buy to join the existing trend.
The Stop: The stop goes behind the previous bar. This keeps the risk very tight.
Part 3: Trade Management (The “Lots of 3”)
Entering is easy. Managing the trade is where the money is made. I use a scaling method designed for small accounts called “Lots of 3.”
1. The Entry You enter with a multiple of 3 contracts (e.g., 3, 6, or 9).
2. The Initial Target (Bank the Cash) We do not wait for a home run to get paid.
The Rule: Take 2/3rds of your position OFF at the initial target (usually when profit equals 1/2 of your risk).
The Initial Target = Entry – Stop Loss / 2
Why? This puts cash in your pocket immediately. It pays for the trade.
3. The “Free Trade” Once you sell those first 2 contracts, you move the Stop Loss on the remaining runner to Break-Even.
Result: You cannot lose money on this trade. You are now playing with “House Money.”
Part 4: The Exit (The Trailing Stop)
Now that you have a “Runner” (the last 1/3rd of your position), you let it run as long as possible. You never guess the top.
The Routine: Every day at the close (or the next morning), look at the bar that just finished.
The Rule: Move your Stop Loss to one tick below the Low of the Previous Day (for longs).
The End: Eventually, the trend will turn. The price will hit your trailing stop. The computer takes you out automatically.
The Real Life Example: Silver
Let’s look at the actual charts from the historic Silver rally we just saw in January 2026. This isn’t a theory; this is what really happened.
For simplicity purposes, we are trading 1 Silver Futures Contract (Symbol: SI).
Contract Size: 5,000 ounces.
Leverage: Every $1.00 the price moves = $5,000 profit per contract.
The Setup: Wednesday, January 21 - On Wednesday, it closes strong at $92.64. The trend is up. The system gives a green light.
Action: You buy 1 Futures Contract at $92.64.
Stop: You place your initial stop below the recent swing low.
The Ride: Climbing the Ladder Now, you stop thinking. You turn off the TV. You just follow the Trailing Stop rule.
Jan 22 (Thursday): Silver rallies to $96.37. The Low of the day was $90.68.
Action: Move stop to $90.60 (below today’s low). You are safe.
Jan 23 (Friday): The price surges to close at $101.33. The Low was $96.22.
Action: Move stop to $96.20. You have now locked in profit. You cannot lose.
Jan 26 (Monday): The market goes vertical. Silver hits $115.15. It feels like a bubble. Your brain screams “Sell!” But the robot says “Hold.” The Low was $101.51.
Action: Move stop to $101.50.
Jan 27 (Tuesday): A scary day! Volatility explodes. The price dips, but the Low holds at $102.59. It does not hit your stop.
Action: You stay in. Move stop to $102.50.
Jan 28 (Wednesday): The rally resumes. Price hits $113.16. The Low of the day is $110.49.
Action: Move stop to $110.49.
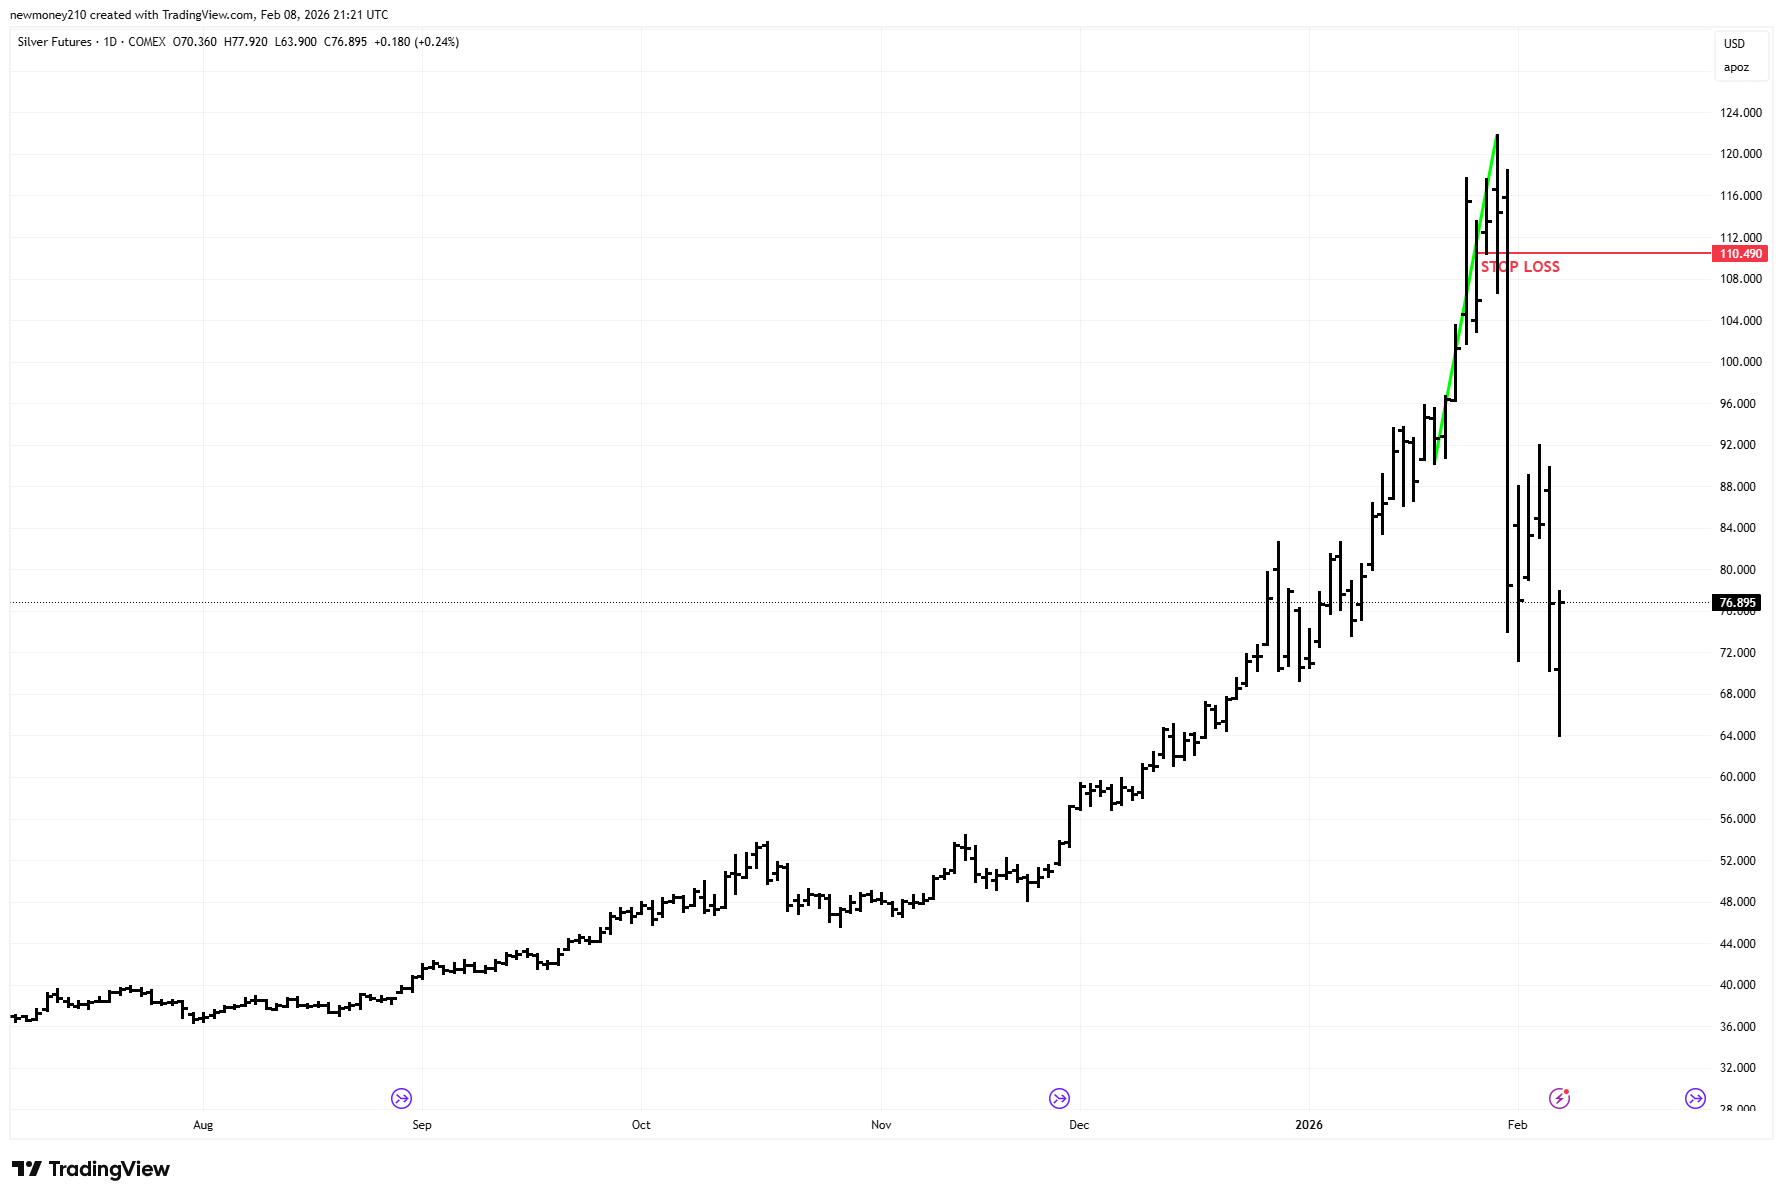
The Payday: January 29 On Thursday, Jan 29, history is made. Silver touches an all-time high of $121.78. It looks like it will go to the moon.
But then, gravity wins. The price cracks. It drops from the highs, crashing down to $106.
The Exit Because you followed the rule, you didn’t ride the crash to the bottom. As the price fell through $110.49 (yesterday’s low), your Stop Loss was triggered.
The Scorecard
You bought at $92.64. You were stopped out at $110.49.
Entry: $92.64
Exit: $110.49
Profit per Ounce: $17.85
Total Profit: $17.85 x 5,000 ounces = $89,250
In exactly 7 trading days, a complete beginner could have made $89,250.
You didn’t need to know about the supply deficit. You didn’t need to predict the crash. You just needed the discipline to follow one simple rule: Trail the stop.
The market offers these rides a few times a year. The “smart” money usually over-thinks it and misses out. The “dumb” mechanical trader just hops on and enjoys the ride.
The elegance is in the execution
—Brian
This is for daily... could also be used on weekly but that creates much bigger risk levels (stop loss levels are huge).
To day gold price daily chart look like it is up trand. But it's momentem suppose to go down. I feel stuck. Which direction should I be on position. Buy or sell sir?